I have some frequency chart examples.
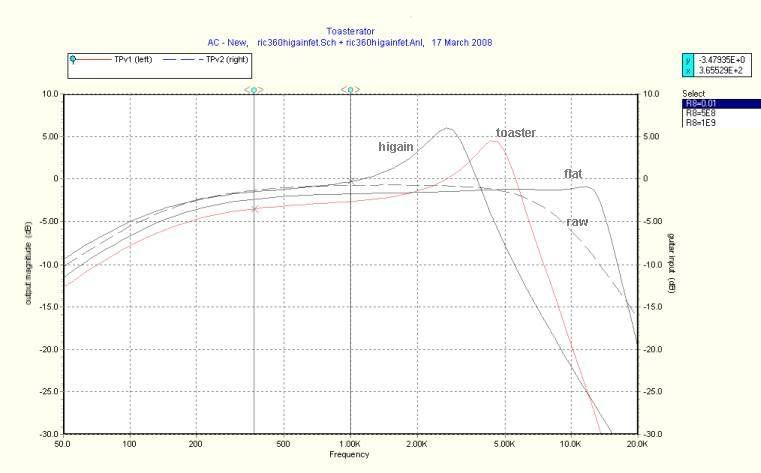
This is from a SPICE model of a device I am designing to get a more toaster like sound from higains. The model includes the 360-12 guitar circuitry.
My device won't be an exact duplicate because the magnetic feilds are not the same in the two pickups. It's what I call convolution filtering. However I will soon be able to measure it.
So this lumped parameter model shows MOST of the difference, but not all.
Note the higain has a much lower self resonance at nearly half the frequency of the toaster. big difference.
You may wonder what the other two curves are. The dotted line (raw) is the unloaded response (no guitar cord or amp) and the "flat" is a new setting I developed for the device that extends the response past 12 kHz and removes any peak. The higain usually tanks above 5kHz.
However, I like the higains for many things. Now I hope to get most of the toaster sound by flipping a switchrather than grabbing screwdriver and soldering iron.
An earlier version of this device works pretty well. I'm making it just for my own use really...just for fun.
Here it is: